


We often find ourselves sitting in front of our clients talking about results: the number of inquiries generated, web conversions, calls that came in, new vs. returning visitors to the website and so on. These are all great stats to see how the marketing dollars are working, but … what happens next? How do I know if my senior living sales team is nurturing leads? Most importantly, to what benchmarks should the sales team be performing?
Lots of articles and studies analyze sales benchmarks and statistics, but not many are senior living specific. In honor of my 7th anniversary of being part of this great team at Creating Results, I’m going to share with you the top 7 statistics and benchmarks for measuring the effectiveness and performance of your sales team.
1) 228: Average call-outs per month in independent living
For an independent living salesperson, a call-out means making a meaningful connection to a prospect, speaking with that individual and looking to advance the prospect to the next logical step. This doesn’t include tours or other sales activities (emails in/out, mailings, personal letters, etc.). On average, an effective salesperson should be completing 325 activities per month. SOURCE: Enquire 2017 Sales and Marketing Benchmark Report

2) 25: Average touches from inquiry to move-in for independent living
When looking at the average number of activities from inquiry to deposit in our current client’s CRM databases, and in consulting with various sales teams, we find (in conjunction with industry data) that it takes an average of 25 touches for each independent living sale. What is a touch? Calls, emails, appointments, attendance at events, etc. If you think about it, if the average independent living prospect takes 2 years to decide, that means 12 touches in a year or one touch a month (per prospect). And it’s not just quantity. Quality content is particularly important. The more personalized and helpful you are to a prospect, the better the sales conversion rate will be.
3) Odds of reaching a lead decreases by more than 10 times after the first hour
Mind-blowing, right? As web leads continue to increase, and our world becomes more real-time, the speed at which you respond to a prospect becomes more important. McKnight’s Senior Living reports that 39% of senior care marketers wait more than 12 hours to respond to one lead and about half are in the one- to three-hour range. Even a simple response and noting that you received their inquiry online is enough to keep them engaged. The faster you are at responding and being attentive to that lead, the more likely you are to move them into your community.
4) 2.8: Average new independent living leads to initial presentations
Most of you are all familiar with the CRM REPS (now MatrixCare). For those that are in the middle of converting, and have access to activity reports, one key benchmark to look at is the number of new leads to initial presentations. On average, across several of Creating Results’ independent living communities, it takes nearly three leads to set an initial appointment with one. This equates to approximately 36% of all new leads in a given year.
5) 47%: Percentage of Life Plan (CCRC) residents who move in after two years of starting search
Moving into an independent living retirement community, especially for those at the younger end of the 65+ bracket, is not a decision made within 90 days of inquiring. Many reports across our industry, including those we produce for our own clients, show that nearly half of those that moved in over the last 10 years, it took approximately 2 years to do so. Of the 47%, nearly 16% are in the 3-4-year range. Moral of the story: Patience is a virtue and prospects need time and help along the process.

6) Average senior living sales conversion for web leads alone: 23%
For a number of Creating Result’s clients, when we look at the total number of deposits in the year and how many were directly attributed to web, the average is around 23% (some as high as 40%). If nearly a quarter of your sales will be directly from the web, it’s important to start nurturing them and gaining their trust sooner. Let’s put this into perspective. Say your community receives 500 web inquires in a given year. If 200 of those are truly qualified leads, 46 of those will close over time. That would equate to almost four senior living sales per month, not factoring in any other marketing initiatives, such as print, direct mail, broadcast or general knowledge of your community.
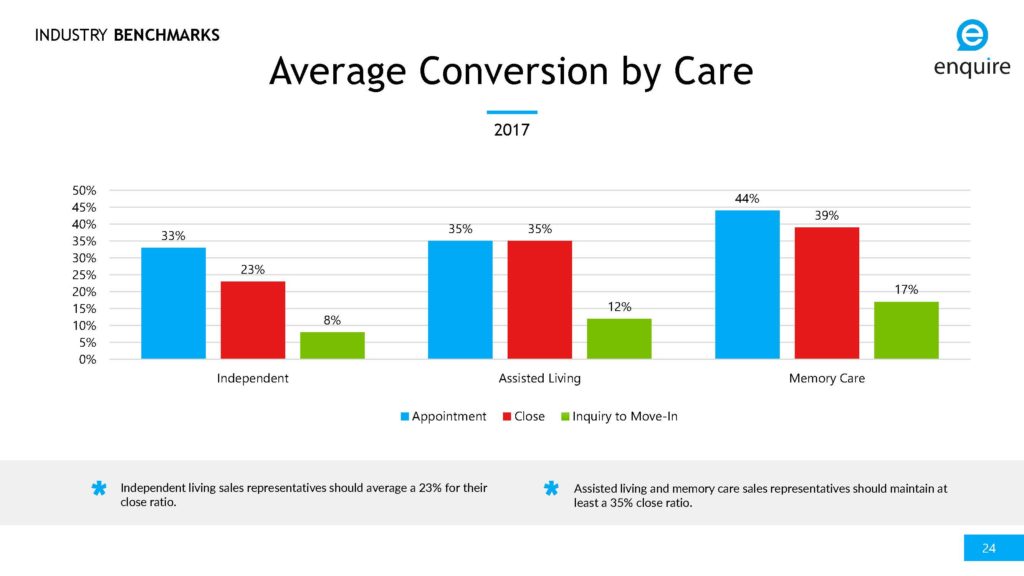
7) Inquiry to move-in ratios range from 8% to 17% depending on care level
This is probably one of the most sought-after statistics that I’ve encountered in my time as a sales strategist. CRM specialists, Enquire, shared in their 2017 study that inquiry to move-in percentages vary by care level. For independent living it’s around 8%, for assisted living 12% and for memory care 17%. Looking at the chart below, you can see from the Enquire study that the average close ratio ranges from 23% (independent living) to 39% (memory care). For independent living, that means 23% percent of ALL inquiries will close somewhere along the line.
How Does Your Senior Living Sales Team Compare?
Are you aware of how many activities they are achieving in a month? What about their conversion rate? If you’re unsure, we can help you find the answers, set goals and evaluate performance.