


Lots of articles and studies analyze sales benchmarks and statistics, but not many are senior living specific. Here are the top 8 statistics and benchmarks for measuring the effectiveness and performance of your sales team.
127: Average call-outs per month (per 100 units) in independent living
For an independent living salesperson, a call-out means making a meaningful connection with a prospect, speaking with that individual and looking to advance the prospect to the next logical step. This doesn’t include tours or other sales activities (emails in/out, mailings, personal letters, etc.).
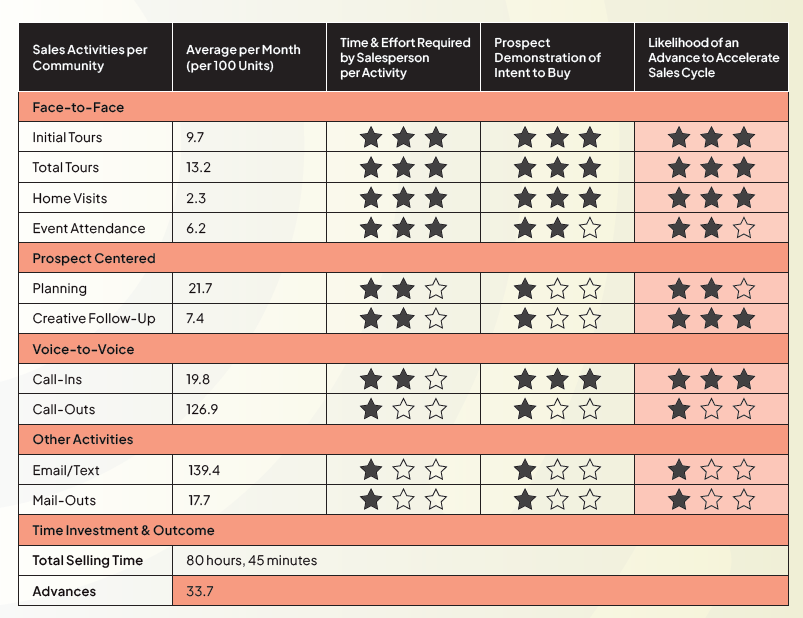
However, be careful not to prioritize quantity over quality. One 30-minute conversation is obviously much more impactful than 30 one-minute calls that result in a voicemail. The goal of the call is to advance the sale and gain higher quality call-ins and face-to-face interactions. On average, it takes about 3 call-outs to make contact with a prospect (37% contact rate).
Source: 2023 Aline Annual Sales and Marketing Benchmark Report
1 hour or less: Optimal speed to lead
The overwhelming majority of senior living prospects (75%) end up going with the first community they talk to, and your odds of connecting with that prospect are the highest within 5 minutes of the inquiry. They’re available and in the right mindset, even if they say they’re “just looking” — something prompted the prospect to reach out. What’s more, the odds of reaching a lead decline dramatically after the first hour.
And yet, most communities take 24–48 hours to respond to an inquiry. If you don’t have a system set up to manage speed to lead, you’re losing tours. You must ensure that people who call will reach someone who can help — including outside traditional Monday–Friday business hours — and you have a system in place for responding to online inquiries.
Let’s also talk about what this stat doesn’t mean. We’ve all had the experience of submitting an online form only for the phone to ring a moment later. You think, “If I wanted to talk, I would have called!” Instead, give your prospect options for how they’d like to be contacted: phone call, text or email. And be sure your online form sets up the right expectation: Are prospects simply downloading a resource or are they also signing up for a phone call? If so, make that clear. Don’t promise one result and then expect another.
Source: Senior Housing News Sales Summit 2023 webinar series
25: Average touches from inquiry to move-in for independent living
When looking at the average number of activities from inquiry to deposit in our current client’s CRM databases, and in consulting with various sales teams, we find (in conjunction with industry data) that it takes an average of 25 touches for each independent living sale. What is a touch? Calls, emails, appointments, attendance at events, etc. This number hasn’t changed since our first review of the data back in 2018.
In independent living, the average sales cycle is about 315 days. That equates to about 2.5 touches a month. Here, too, quality is critical. The more personalized and helpful you are to a prospect, the better the sales conversion rate will be.
26%: Inquiry-to-tour ratio in independent living
On average, a little more than a quarter of inquiries will come tour your community. And just under 30% of those who take a tour will end up moving in. That means your strategy needs to account for these averages and ensure your marketing can net enough inquiries to ultimately reach your sales goal.
Need help identifying how many inquiries you need to reach your sales goals? Use our online calculator to determine your marketing-qualified leads goal.
Source: Senior Housing News Sales Summit 2023 webinar series
6%–13%: Inquiry-to-move-in ratios (depending on care level)
This is probably one of the most sought-after statistics that I’ve encountered in my time as a sales strategist. For independent living, it’s around 6%–8%, for assisted living, 9%, and for memory care, 13%. These percentages mark a decrease from when we first compiled this information in 2018, especially in the higher levels of care. While it’s unclear why conversion rates have declined, additional competition and savvier prospects inquiring at multiple communities likely play a role.
39%: Percentage of life plan (CCRC) residents who move in after 2 years of starting their search
Moving into a retirement community, especially for those at the younger end of the 65+ bracket, is not a decision made within 90 days of inquiring. Many reports across our industry, including those we produce for our own clients, show that nearly half of senior living prospects who moved in over the last 10 years took about 2 years to do so. Of the 39%, nearly 10% are in the 3- to 4-year range. Moral of the story: Patience is a virtue and prospects need time and help along the process.
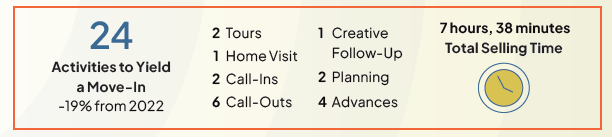
7.5+ hours: Total selling time per move-in
On average, an independent living salesperson will spend close to 8 hours on sales activities for 1 move-in over the course of the prospect’s journey. Interestingly, despite being more needs-based, higher levels of care still command a similar amount of time, with just about the same amount of selling time needed for memory care and about 6.75 hours for assisted living.
Interestingly, life plan communities tend to spend the most time on a sale: close to 12 hours on average. It’s likely that a lower overall conversion rate of 6% accounts for at least some of this additional time.
Remember, too, that salespeople aren’t just working leads who move in. They’re spending significant amounts of selling time on leads who will ultimately be lost as well. The key is to invest time wisely — spending the most time on high-quality activities that are most likely to advance the prospect to the next step in their journey.
Source: 2023 Aline Annual Sales and Marketing Benchmark Report
45%: sales conversion from digital leads
Based on our experience in working with senior living sales teams for over 30+ years, digital leads have a huge growth potential. Why? Simply put, salespeople tend to disregard digital leads more quickly than traditional leads, and much prefer working traditional leads. But the fact is, digital leads are not only less expensive than traditional leads, they’re also faster to convert.
For several of Creating Result’s clients, when we look at the total number of deposits and sales in the year and how many were directly attributed to digital channels, the average is around 45% (some as high as 55%). If nearly half of your sales will be coming from online channels, it’s important to start nurturing them and gaining their trust sooner. Let’s put this into perspective. Say your community receives 500 web inquires each year. If 200 of those are truly qualified leads, 90 of those will close over time. Over 2 years, that would equate to almost 4 more sales each month, not factoring in any other traditional marketing initiatives, such as print, direct mail, broadcast or outdoor (e.g., billboards).
How well is your team performing to these senior living sales benchmarks?
Are you aware of how many activities they’re completing in a month? What about their conversion rate? If you’re unsure, we can help you find the answers, set goals and evaluate performance.